From Foundation Ex
This article is composed from Eleni Minga’s presentation
at the 2022 Foundation Ex conference.
In the Foundation Ex presentation, I discussed the use of statistical approaches to assess the deterministic values that we use for design parameters. The session focused on fatigue design, which is often the driver in design of offshore wind monopile foundations. I started by taking a very quick look at the SN-curve-based fatigue design. The fatigue damage is calculated by the following equation:

Where ni is the number of cycles at a specific stress range and Ni is the number of cycles at this stress range that would lead to failure. Ni is of course derived from the SN-curves:
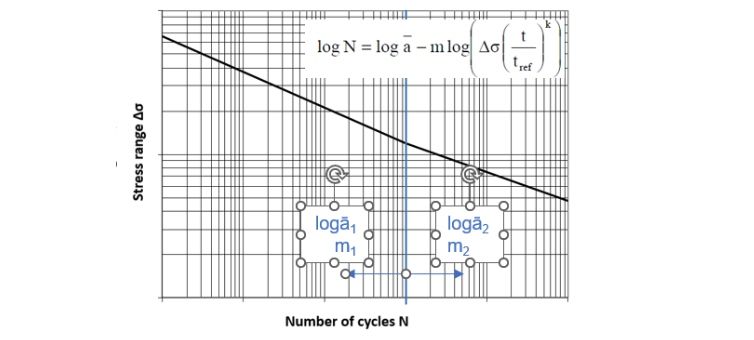
This means that we can rewrite the fatigue damage equation using the SN-curve parameters as follows:

From the fatigue damage we can estimate the fatigue life of the structure:
This is a summary of the deterministic approach routinely used for fatigue design.
In reality, all these parameters are not deterministic; they can take values from a range based on a probability distribution. When we do the design, we always select values on the safe side of this distribution, i.e. we are being deliberately conservative. The question I am discussing here is the following:
Can we assess how conservative we are being?
Which is essentially the same as asking:
Can we decide how conservative we want to be?
The way to do that is by using a probabilistic framework, which allows us to introduce the uncertainty in the parameters.
Introducing Uncertainties
When we introduce uncertainties, through a reliability model, we go from a single number (fatigue damage or fatigue life) to a probability function that gives us the probability of failure throughout the service life of the structure.
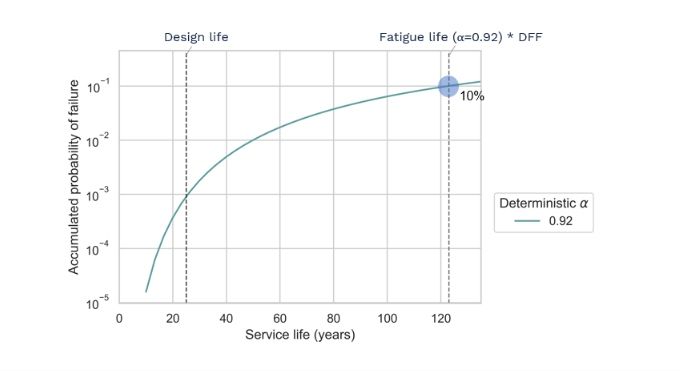
As we can see from the plot below (taken from the DNV code), if we introduce the uncertainties in the SN-curve parameters, the Miner summation and the stress ranges, we expect the structure to accumulate a probability of failure of ~10% at the fatigue life.
In the reliability model, we can introduce uncertainties in other parameters as well. We can then use this reliability analysis to assess the deterministic values used in the design.
I am going to demonstrate this approach through a case study, in which we examined the design values for the availability parameter in the EA-Hub project in collaboration with SPR.
Case Study
The availability (α) of a WTG is defined as the proportion of the design life of the structure in which the wind turbine (WT) is working, i.e it is not parked due to failure).
In general, the design life of an offshore WT foundation can be divided in four periods (see figure below) and the proportion of time that the structure spends in each of them depends on the availability parameter.
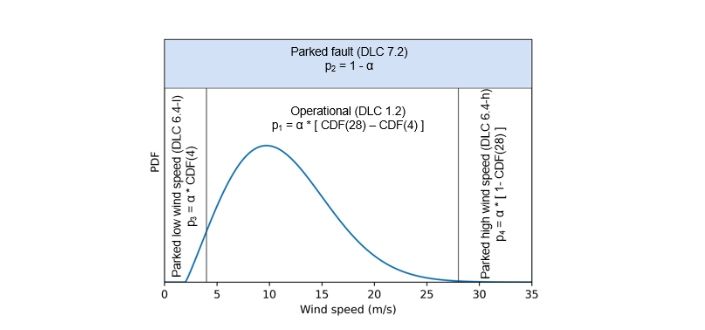
Now, why is the availability important for fatigue design? This is because at the parked state the damping of the structure is much lower and therefore fatigue damage accumulates much faster. The most common design value for the availability parameter is 92%.
Real Data
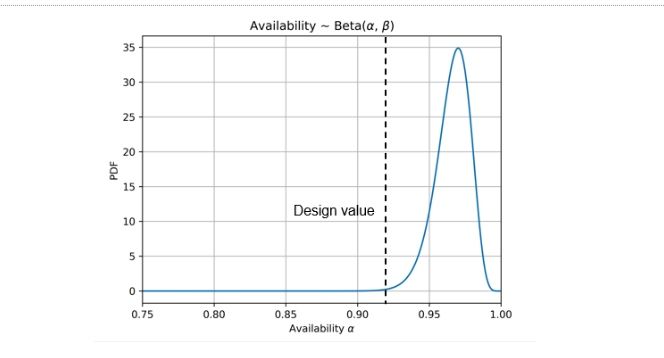
But let’s not forget that nowadays we have real data from operational wind farms that we can use to get a probability distribution for this parameter. The plot below shows a Beta distribution fitted to real data from an existing wind farm with similar characteristics.
Now having a realistic availability distribution at hand, we can compare the probability function that we get using this data to the function that we get with the deterministic design value.
To do that, we perform a reliability analysis using, first, deterministic values for the availability, and then, the distribution of availability. The other probabilistic variables included in the model, together with their probability distributions, are shown in the table.
The result of this analysis is the probability of failure as a function of the service life and the availability.
Results of this Analysis
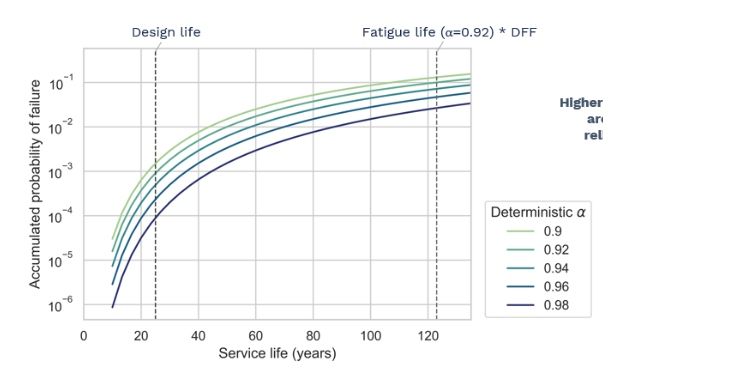
Let’s see the results of this analysis. First, we look at the probability function with a 92% availability (deterministic value). In this case, as expected, the accumulated probability of failure reaches the 10% threshold at the fatigue life.
If we vary the value of the deterministic availability parameter, the higher the value the lower the probability of fatigue failure at any point during service life. This is of course expected, since a higher availability parameter means that the structure will spend less time in the onerous parked state.
But the interesting question is:
What happens when we consider the uncertainty in the availability, i.e when we include the availability as a probabilistic variable in the model with the Beta distribution we showed before?
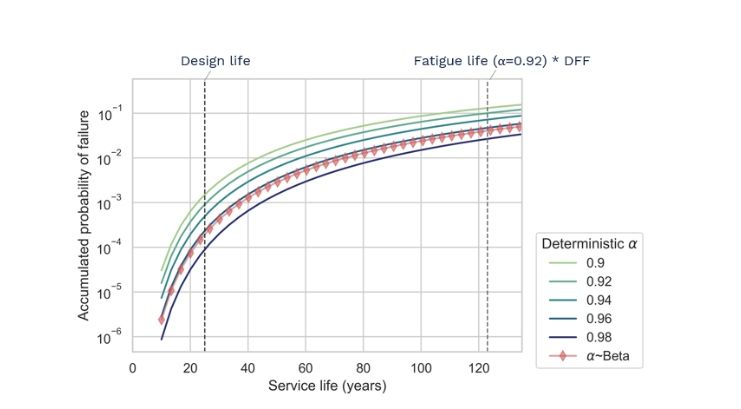
Then we get the red curve in the figure which shows that, for the entire service life, the probability of failure pf(~Beta) is consistently smaller than the probability of failure with α=92%. In fact, pf~Beta is also consistently lower than the 94% deterministic curve, which means that if we used a 94% design value for the availability, we would still be on the safe side.
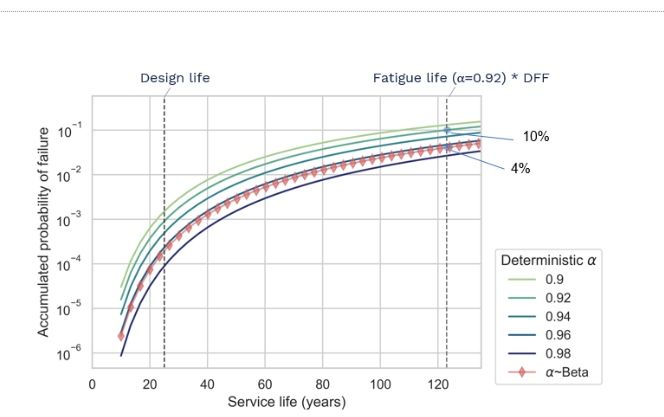
From this same plot, we can see that when the 92% deterministic curve reaches the threshold of pf=10%, the probabilistic curve is at pf=4%. These numbers might not make a big impression.
But the difference becomes much more telling if we look at how many more years it will take to reach the max acceptable pf of 10% with the probabilistic curve. The figure below shows that it would take 60 more years to reach at this limit.
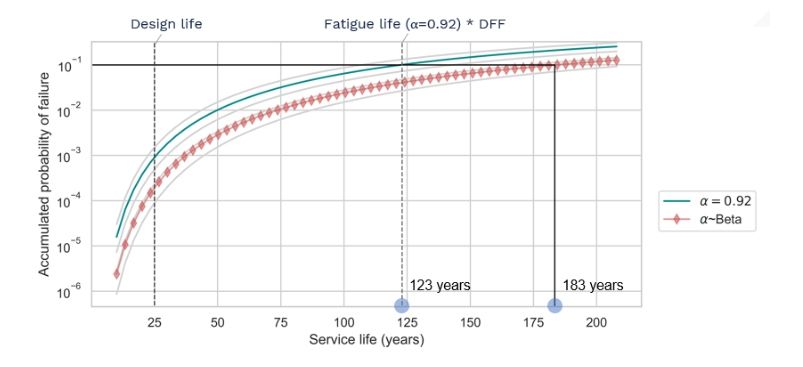
If we take into account the DFF, this means that the Fatigue Life of the structure is estimated at 61 years instead of the 41 years that we get with the 92% design value. We did this analysis in multiple locations and the estimated fatigue life is always 50%-70% higher when we consider the uncertainty in the availability parameter, which shows the extra margin of safety or the conservatism that is associated with the choice of 92% availability.
Final Thoughts
Some comments based on the discussion presented above:
- Nowadays, we have available data from operational wind farms which can give us information about parameter distributions.
- Probabilistic modelling can be used to select/update our design parameters to be less conservative, while keeping track of the associated risk.
- Probabilistic modelling can be used to simply assess the margins of safety, i.e. to be aware of how conservative we are being.
- Using data from existing wind farms, we can update the reliability and estimate the remaining life of the structure.
Empire specialists can effectively and efficiently assist with your offshore wind project. To find out more, please get in touch with the team at Empire Engineering.

